.evaluate()
🔬
In the practice of machine learning, which is broadly equivalent to ‘Artificial Intelligence’, we produce models to predict outcomes based on input data. One such model is known as a classification model. This card shows an example of what is known in this field as a confusion matrix, which is a tool to visualize the performance of a classification model. It is an efficient way to visualize how well a model is doing: if the diagonal of the matrix is dark and the remaining cells light, then our model is performing well.
🧩
Our own models of the world are generally flawed; we make good decisions most of the time, but occasionally we make bad ones too. This card invites us to engage in self-reflection about how well our internal models are faring and to be able to visualize them more objectively.
Consider the following example of choosing whether to drink coffee or water at a given moment.
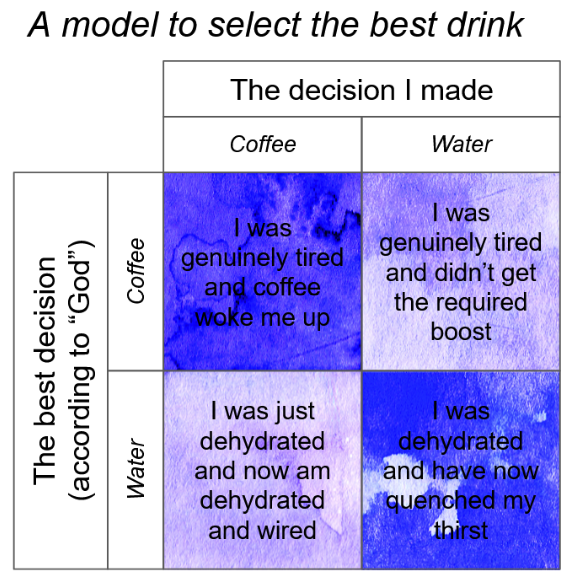
Here, the a dark square means the given combination is experienced frequently, and a light square, infrequently. In this example, we see that the person generally drinks both coffee and water when they need to (dark squares = high proportion of overall choices), but there are occasions there they make the wrong decision, compared to what they should have done (light squares = low proportion of overall choices). In the ideal case, the boxes on the diagonal should be dark, and the remaining boxes (off-diagonal) should be light.
Armed with this information, we can find out what deserves our attention. If the off-diagonal boxes are dark, this suggests that our decision making model is broken in some way.
🖋️
- How might you apply this tool to better understanding other major life decisions, such as selecting jobs, clients or dating partners? Bear in mind the framework of “what I actually did/didn’t select” versus “what I should/shouldn’t have selected” (according to hindsight, or some other feedback).
Return home.